
Data analysis for business
Table of Contents
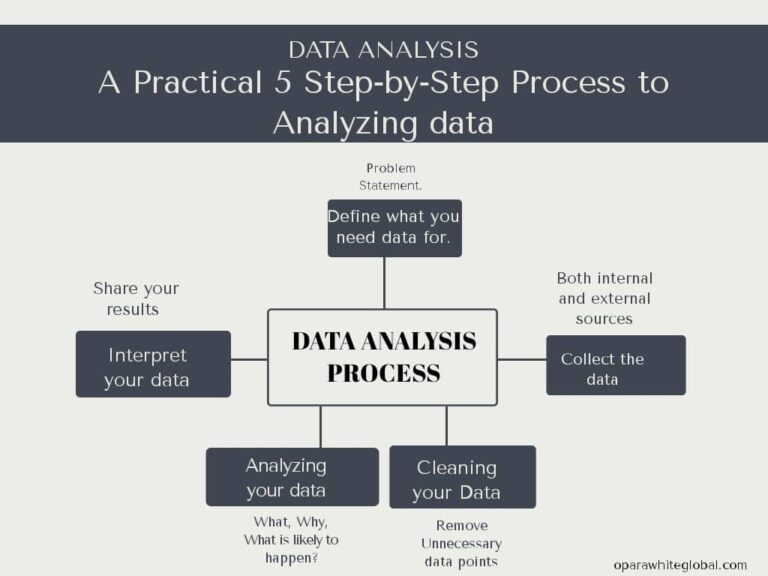
What is data analysis for business?
Data analysis for business is the process of gathering, analyzing, and providing managers with actionable information to aid in greater understanding, strategic decision-making, the accomplishment of significant goals, and the resolution of challenging issues inside an organization.
Data analysis for business entails deploying data analysis to help a business in increasing its performance, efficiency, profit, or strategic thinking in its decisions. It typically focuses on key areas such as; research (e.g.; product, target market), risk assessment and management, financial survey, stakeholder and partnership analysis, etc.
Top four tools for data analysis for business
Microsoft Power BI
Microsoft Power BI is a leading business intelligence platform which supports a large number of data sources. Users can make and share dashboards, visualizations, and reports using this tool. Users can combine several dashboards and reports into a PowerBi app for easy deployment. Also, Power BI allows users to create automated machine learning models and the software connects with Azure Machine Learning. PowerBi was released in 2011. PowerBi users include; data scientists, business analysts, data analysts, and businesses that deal with large amount of data from several sources.
Features of PowerBi
- AI and machine learning: Power BI comes equipped with AI and machine learning capabilities. With Power BI, you can perform natural language queries, key driver analyses, and sentiment analyses. As a result, you’ll be able to learn things that might not be obvious to you if you were only using the data you already have.
- Custom visuals: Power BI gives its customers access to a collection of open-source, fully configurable data visualisation tools. Using developer tools, you may create your own Power BI custom graphics, test and debug them, and then apply to have Microsoft certify them. It takes some work, but if you play your cards well, it will be worthwhile in the end.
- Data security: Data security is a top priority for Microsoft. According to its website, more than 3,500 of the top security researchers in the world work diligently every day to defend consumers from threats in conjunction with strong AI models. In order to shield its consumers from cyber threats, Microsoft actually transmits over 6.5 trillion signals daily.
- Data modelling: Power BI provides remarkable data modelling features that can significantly ease the life of a business analyst. You can use the platform to aggregate, shape, and convert data from several sources into a single data model. In order to extract all insights from your data, you can link tables together, add calculated columns and measurements, and apply sophisticated data transformation techniques.
Powerbi users
Business Analysts
Data Analysts and Data Scientists
Data Engineers
IT Professionals
Financial Analysts
Operations Managers
Executives and Decision-Makers
Manufacturers
Energy and Utilities and any organization that uses large amount of data
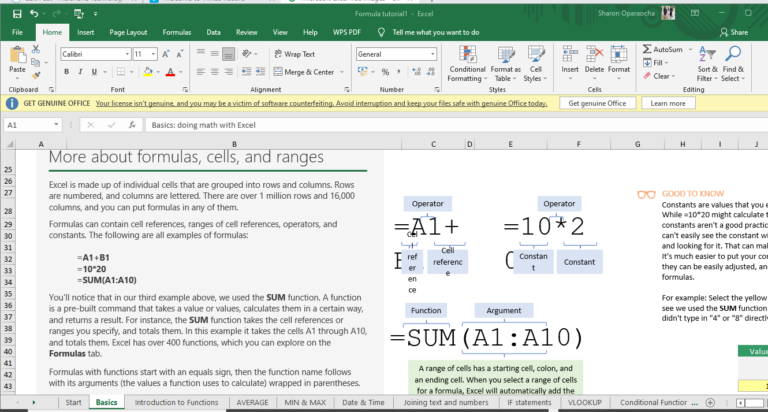
Microsoft Excel
The most popular tool for working with spreadsheets and creating analyses is Microsoft Excel. Excel has undergone decades of development and can be customised using its built-in programming language, Visual Basic. It can support practically any conventional analytics workflow.
Features
Microsoft Excel is a versatile spreadsheet software with numerous features. Here are ten key features of Microsoft Excel:
Grid interface: Excel’s main interface is based on a grid of cells arranged in rows and columns, making it easy to organize and input data.
Formulas and functions: Excel allows users to create complex calculations and perform various mathematical operations using built-in functions and formulas. Examples include SUM, AVERAGE, IF, and VLOOKUP.
Charts and graphs: You can create a wide range of charts and graphs to visualize your data, including bar charts, pie charts, line graphs, and scatter plots.
Data sorting and filtering: Excel provides tools to sort and filter data, making it easier to analyze and find specific information within a large dataset.
Data validation: You can set rules to validate data input, ensuring that it meets specific criteria. This helps maintain data accuracy and consistency.
Conditional formatting: Excel allows you to apply formatting rules based on cell values, making it easy to highlight important information or trends in your data.
PivotTables: PivotTables enable you to summarize and analyze large datasets quickly. They are especially useful for creating dynamic reports and summaries.
Data import and export: Excel supports importing data from various sources like databases, text files, and web services. You can also export data to different formats such as CSV, PDF, and HTML.
Collaboration: Excel offers collaboration features like real-time co-authoring in Excel Online, comments, and the ability to share spreadsheets with others through OneDrive or SharePoint.
Macros and automation: Excel allows users to record and run macros, which are sequences of actions that can automate repetitive tasks, saving time and reducing errors.
These features make Microsoft Excel a powerful tool for data analysis, reporting, and managing various types of information.
Excel users
Excel serves various kinds of users;
Data analysts & scientists
Mathematicians
Financial auditors
Accountants
Data entry officers
Health workers
Developers
Bankers
Engineers
Financial analysts
Statisticians
Business developers
Project managers, etc.
Qlik
Qlik is a business analytics platform that offers real-time analytics, data visualization, data security, and automatic data modeling. The company is well-known throughout the world among data analysts for its potent products, including QlikView and QlikSense.
Features of qlik
- Real-time analytics: Users may immediately assess the situation and make informed decisions with the aid of real-time (most current) information. With Qlik, users can effortlessly keep an eye on several metrics while monitoring real-time data. When data changes, Qlik can also notify users via alerts so they can act right away.
- Data visualization: Users can quickly see trends and patterns with Qlik’s cutting-edge visualisation, which makes analysing complex data much simpler. Qlik can present data in a highly effective manner using charts and maps.
- Data Integration: Qlik can connect to a wide range of data sources, including databases, spreadsheets, web services, and more, making it easy to consolidate and analyze data from various systems.
- Data Visualization: Qlik provides a rich set of data visualization options, including interactive charts, graphs, and dashboards. Users can create custom visualizations to represent their data effectively.
- Advanced Analytics: Qlik supports advanced analytics and predictive modeling capabilities, allowing users to uncover insights, identify trends, and make data-driven predictions.
- Self-Service BI: Qlik’s user-friendly interface empowers business users to create their own reports and dashboards without relying on IT or data experts, promoting self-service business intelligence.
- Data Governance: Qlik offers robust data governance features, including data security, role-based access control, and data lineage tracking to ensure data integrity and compliance.
- Collaboration and Sharing: Users can collaborate on reports and dashboards, share insights, and annotate visualizations. Qlik also supports integration with collaboration tools like Slack and Microsoft Teams.
- Mobile Accessibility: Qlik provides mobile apps and responsive design, enabling users to access and interact with data on smartphones and tablets, ensuring data accessibility on the go.
- Cloud Deployment: Qlik offers cloud-based solutions, allowing organizations to deploy and manage their analytics environments in the cloud, reducing infrastructure overhead.
Qlik users
Qlik’s products are ideal for business analysts, marketers and sales experts, financial analysts, and data scientists and small to large businesses.
Tableau
Tableau is best defined as an interactive data visualization software which allows users to create reports and share them across desktop and mobile platforms, in a browser, or embedded in an application. It can operate locally or on the cloud. VizQL, the foundational query language of the Tableau platform, powers a large portion of it. This reduces the requirement for end-user speed optimisations by converting drag-and-drop dashboard and visualization components into effective back-end queries. Tableau does not, however, enable complex SQL queries.
Features
• Drag-and-drop: Tableau doesn’t require you to be a software engineer to use it to its full potential. This platform provides an easy drag-and-drop interface for building dashboards and data visualizations with a polished appearance.
• Use of mobile devices: We must now make judgements for our jobs while on the road. The good news is that Tableau is mobile-optimized, making it simple to access and comprehend complicated data from any location.
• Advanced data blending: Tableau gives customers the ability to combine data from numerous sources. This implies that you can access both primary data and secondary data on a single platform. You can mix everything, including spreadsheets and data from the cloud.
• Modifiable dashboards: Tableau enables you to build an interactive dashboard that makes it simpler to analyses data. Web pages, blank items, navigation spaces, and extensions are a few examples of features you can add.
Who is it for?
Tableau’s various versions are suitable for the following:
- Business intelligence professionals
- Data scientists
- Decision-makers
- Sales and marketing teams
- Retailers
- Healthcare providers
SAP BusinessObjects
SAP is a flexible software package that supports a variety of users and company needs. Because of its adaptability and scalability, it may be used by enterprises of all sizes and in all sectors, from small startups to huge international firms. However, based on the requirements and goals of the company, other SAP modules and functionality may be implemented. Additionally, it enables self-service predictive analytics.

Features
Integrated Business Processes: With the use of SAP, multiple departments, including finance, supply chain, human resources, procurement, sales, and more may integrate and streamline important business activities. By enabling real-time data exchange and collaboration, this integration minimizes errors and laborious data entry.
Analytics and Reporting: SAP provides enterprises with powerful reporting and analytics solutions that help them make sense of their data. In order to measure key performance indicators (KPIs), monitor performance, and make data-driven choices, users can develop custom reports, dashboards, and visualizations.
Customization and Extensibility: SAP may be tailored to satisfy the unique requirements of many enterprises and industries. Users can customize the program through configuration and development, and SAP offers tools and APIs for developing custom applications and integrating them with systems from other companies.
Scalability: SAP is made to grow together with an organization. Whether a company is small, medium-sized, or large, SAP can adjust to changing needs, support growing data quantities, and satisfy user demands.
Security and Compliance: Scalability: SAP is made to grow together with an organization. Whether a company is small, medium-sized, or large, SAP can adjust to changing needs, support growing data quantities, and satisfy user demands.
Data security and regulatory and industry compliance are two areas that SAP focuses a lot of attention on. It has features for data encryption, user authentication, and audit trail management. This is crucial for sectors like healthcare and finance that have stringent data protection and compliance standards.
It’s important to note that SAP is
Who can use SAP?
Business Users
IT Professionals
Managers and Executives
Data Analysts and Data Scientists
Supply Chain Professionals
Financial Professionals
HR and Payroll Teams
Manufacturing and Production Teams
Customer Service and Sales Teams
Procurement and Supplier Management Teams
Logistics and Warehouse Management Teams
Industry-Specific Professionals
Google Analytics
Google Analytics is a web analytics service that offers data and fundamental analytical capabilities for marketing and search engine optimisation (SEO) needs. Anyone with a Google account can use the service for free and it is a part of the Google Marketing Platform.
To monitor website performance and gather visitor data, Google Analytics is employed. Organisations can use it to identify the main user traffic sources, evaluate the effectiveness of their marketing initiatives and campaigns, track goal accomplishments (like purchases and cart additions), identify patterns and trends in user engagement, and gather other visitor data like demographics.
Features
Google Analytics is a powerful web analytics service provided by Google that allows website owners and marketers to track and analyze various aspects of website traffic and user behavior. It has tools that may be used to assist users to spot patterns and trends in how people interact with their websites. Data gathering, analysis, monitoring, visualisation, reporting, and integration with other applications are all made possible by features. These features consist of:
Website Traffic Analysis: Google Analytics provides detailed insights into the volume of website traffic, including the number of visitors, page views, and sessions.
Real-Time Data: Users can access real-time data to see how visitors are currently interacting with their website, including live traffic sources, page views, and active users.
Audience Reports: This feature helps you understand your website’s audience demographics, including age, gender, location, and device type. You can also track user interests and behavior.
Acquisition Reports: These reports show how users find your website, including information about traffic sources such as organic search, paid search, social media, direct traffic, and referrals.
Behavior Reports: Analyze user interactions with your website, including the most popular pages, the average time spent on pages, and the bounce rate (percentage of visitors who leave after viewing only one page).
Conversion Tracking: Google Analytics allows you to set up goals and track conversions, such as form submissions, e-commerce transactions, and other user interactions that are important to your business.
E-commerce Tracking: For online retailers, Google Analytics offers advanced e-commerce tracking capabilities, enabling you to analyze sales, revenue, and product performance.
Event Tracking: You can track specific user interactions on your website, such as clicks on buttons, video views, and downloads, by setting up event tracking.
Segmentation: Segment your audience based on various criteria (e.g., location, behavior, source) to analyze specific subsets of your website visitors.
Site Search Tracking: If your website has a search function, you can track what users are searching for and how it impacts their behavior on your site.
Custom Dimensions and Metrics: You can define and track custom dimensions and metrics that are specific to your business needs.
Integration: Google Analytics can be integrated with other Google products like Google Ads and Google Search Console, as well as third-party tools to enhance data analysis.
Data Export and Sharing: Export data from Google Analytics or share reports and dashboards with colleagues and stakeholders.
Mobile App Analytics: Track user engagement and behavior in mobile apps using Google Analytics for Mobile Apps.
Who can use it?
Any business with online presence
Digital marketers
Website owners
SEO experts
Conclusion
The foundation of well-informed decision-making is data. Thankfully, the days of meticulous data gathering, and analysis are behind us. Today, thanks to advances in technology, gathering and analyzing data is considerably easier. Whether you’re a small business owner who wants to track website traffic or a sales professional who wants to accurately estimate quarterly sales, modern data analysis systems can handle the majority of the labor-intensive work for you. If you don’t have any experience working as a data analyst, it might be best to employ one because they can recommend the right method and tools for you.
Glad to have learned data analysis for business? Sign up to our newsletter to receive notification about our latest articles.
