
Are you unsure which software to use for analyzing data? Or you stand confused on how to make the best decision amongst the numerous software in the market.
To be able to perform at the highest level possible for data analysis, data analysts must employ the best tools for analyzing data. While executing algorithms, preparing data, generating predictions, or visualizing or reporting data, getting the best results from the tools used by the data analyst.
In as much as many solutions exist in the market, choosing the best tool is a decision that must be taken wisely.
On that note, we have collated the best and most popular tools that can benefit your efforts as a data analyst.
In this article, you will learn the most common and best software you can employ to get the best results from your data analysis efforts.
But first, let’s understand what data analysis tools mean.
What Are Data Analyst Tools?
Table of Contents
Data Analyst tools are terms used to refer to those tools, applications and software used by data analysts to develop analytical processes that help companies make better-informed decisions.
5 Most Common Software for Data Analysis
To help you make the best possible decision on which data analysis tools or software to use, we have compiled a list to help you.
Here are 5 top software professional data analysts use with an overview of the features of the software.
- SAS
- Microsoft Excel
- Python
- Tableau
- R programming / R—studio
SAS
SAS stands for Statistical Analysis System. It is a commercial software suite used commonly for business intelligence, and predictive and multivariate analysis.
SAS is easier for large organizations to use and is built for enterprise markets. It finds its use in profiling customers, data mining, and predictive analysis. Just as we initially mentioned, SAS is commercial software which implies a high cost. But with the cost comes a lot of benefits.
SAS is one of the most common data analysis software used by professionals. Its drawback is that it has poor graphical representation and is costly. However, it is easily accessible and has good user support.
Microsoft Excel
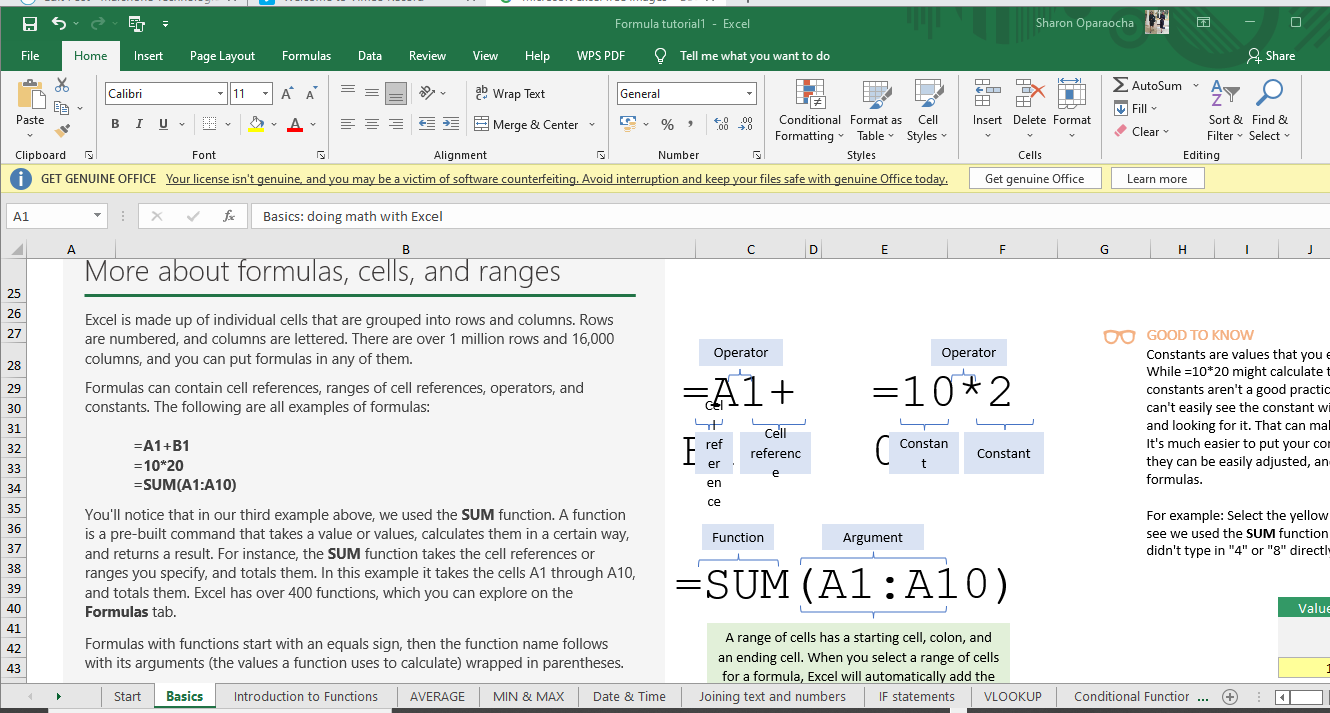
MS Excel is the most popular data analysis software that exists. It is commercial spreadsheet software used for data wrangling and reporting. Excel’s many features make it an invaluable tool in the field of different data analysis.
It doesn’t matter if you are an expert in R-studio or datapine you will surely need excel to do the basic and minor work. Non-data analysts professionals may not have access to these complex tools but will most definitely have excel on their systems.
Excel has some limitations though among which include the inability to handle big datasets and the approximation of large numbers which leads to inaccuracy.
Python
Python is an open-source programming language with tons of free libraries. It is used for data analysis and reporting and it is a must-have for every professional data analyst.
Python is extremely versatile and can be used for so many things from data scrapping to analysis and reporting. The built-in library is suited for various data analysis tasks. For example, the NumPy Library is great for streamlining high computational tasks.
Python’s drawback is in the fact that it is memory intensive and is slower than many other languages.
Tableau
Tableau is a commercial data visualization software and is used for creating data worksheets and dashboards. This commercial software is one of the best software available for creating interactive visualizations without being a coding expert.
Tableau can handle large amounts of data and is very simple to use. However, it is not great for pre-processing data or building complex calculations.
Tableau’s major advantage lies in its great data visualization feature which is top-notch. More so, it is mobile ready which means you can work on the go with Tableau. This makes it one of the most commonly used data analysis software
R programming/ R- studios
R is an open-source programming language commonly used for statistical analysis and data mining.
R was specifically built to handle big statistical computing tasks and it is also popular for data visualization.
R is complex to learn and has no dedicated support team. But then it has a community of users to call on for help. The major drawback of R is that it is slow and complex to learn.
Wrapping up,
From the list above, we will realize that each software mentioned, has some limitations as well as some major advantages.
No one tool can function alone to give you the best result as a data analyst. You still need to have a basic idea of how to use most of the software.
However, we have provided you with a list of the most used software data analysis professionals make use of to get the best results.
So, if you are not sure which one to use or start with, you should make efforts to clearly state what you want to use it for. Then making your choice becomes easier.
Which of the above-mentioned software do you currently use as a data analyst? Share with us in the comment section, why it is your most preferred.